
Or — How the TYCHOS provides a “timely” explanation for our drunken clocks
Everyone has heard of the proverbial broken clock “which will nonetheless show the correct time twice a day”. However, not everyone knows that our earthly clocks are, strictly speaking, almost never on time. In fact, our clocks only agree with the Sun’s midday zenith 4 times a year. The remaining part of the year, our clocks will drunkenly be slipping in-and-out of sync with the Sun by as many as +16 minutes or -14 minutes, depending on the season or time of year!
Any patient photographer can empirically verify this fact by setting up a tripod and snapping pictures of the Sun at noon (say, every ten days or so) for a full year. What will be obtained is a vertically-elongated, “8”-shaped pattern (wider at the lower end) well-known to astronomers. The name given to this shape is the Analemma.

Above — by Anthony Ayiomamitis
“The Sun’s movement against the starry background is gradual — on average about 1 degree a day — but its motion accelerates during northern-hemisphere autumn and winter, then slows down [decelerates] during spring and summer.”
— p.20, Parallax: The Race to Measure the Cosmos by Alan W. Hirshfeld (2001)
Hirshfeld’s description above is incomplete. Here’s a more thorough and accurate description of the Sun’s seasonal West-to-East oscillation. The Sun briefly appears to accelerate from West to East between June and mid-July (i.e.; for a circa 1.5-month period). Then, between November and February, the Sun appears to accelerate again (but this time for circa 3 months). Only on four occasions in the course of a year will our clocks “agree” with the Sun’s zenith at noon. Here’s how this can be illustrated:

What exactly causes this curious analemma phenomenon? Of course, the vertical component (December-June) of the analemma is due to the Sun’s shifting elevation between winter and summer (23.3°X 2 = 46.6°) — so not much mystery there.
On the other hand, the lateral component of the analemma (i.e.; the alternating east/west drift of the Sun) has not, to this day, been adequately explained in any satisfactory manner. As Keplerian theory has it, “it is caused by Earth accelerating / decelerating around its slightly elliptical orbit”. This, we are told, would account for the Sun’s zenith to oscillate in our skies by more than 30 minutes. What sort of magical forces would cause Earth to speed up and slow down is unclear. Here on Earth, there is simply no such physical phenomenon to be observed in nature. Yet, this has somehow been accepted as a scientific fact in absence of any experimental corroboration!
Enter the so-called “Equation of Time“. Here is what we can read on Wikipedia about this matter.
“The equation of time is the east or west component of the analemma, a curve representing the angular offset of the Sun from its mean position on the celestial sphere as viewed from Earth. […] Apparent time, and the sundial, can be ahead (fast) by as much as 16 min 33 s (around November 5), or behind (slow) by as much as 14 min 6 s (around February 12).”
So let’s see: if our clocks, in the course of the year, can be “ahead” by about 16.5 min. and “behind” by about 14 min., the total East-West offset of the Sun in relation to the true zenith would thus amount to 30.5 minutes. Now, how can we possibly accurately measure time and calibrate our clocks with the Sun’s motion if our timekeeper (the Sun) keeps “accelerating and decelerating”?
The so-called “Equation of Time” is a man-made convention devised to deal (to the best of our capacities) with this pesky lateral oscillation of the Sun. In fairness, the “Equation of Time” has provided an ingenious solution to this problem. Yet, the fact remains: our clocks, as useful as they are for our daily purposes, are cosmically-speaking almost never exactly synced with the Sun. So, what is going on? Well, let’s see how the TYCHOS model can account for this.
In the TYCHOS model, Earth is located at the center of our system. The Sun (and all of our surrounding celestial bodies) will therefore alternate between periods of co-directional motions and periods of diametrically opposed motions as viewed from Earth. This will obviously cause the Sun to appear to seasonally accelerate and decelerate in relation to us earthly observers. My below graphic should help visualize this fundamental aspect of the TYCHOS model which explains several historical enigmas of observational astronomy (and probably made Kepler theorize about elliptical orbits).

Here follows a diagram I have borrowed from Wikipedia (and enhanced for clarity) illustrating the seasonal fluctuations of the Sun’s East/West drift — showing a 4-phased sine wave (corresponding to our 4 seasons) of variable amplitudes:

Note that the observed annual “lateral drift” of the Sun adds up to 30.5 min. of RA. However, this is without accounting for the fact that an extra 3.93 min. is added by convention — via the leap-year gimmick, every four years or so. To be precise, 3.78 min. are added on average or over longer periods of time, since some leap years are skipped). Therefore, ¼ of 3.78 min. (i.e.; 0.945 min.) should be added to the annual count of the Sun’s lateral drift, giving us a total of:
In other words, the mean annual (East-West) oscillation of the Sun around its true zenith amounts to circa 31.44 minutes.
We shall now verify whether this apparent “acceleration/deceleration” of the Sun is related to Earth’s orbital speed of 1.601169 km/h (or ca. 1 mph) which, as we have seen, amounts to a mere 0.00149326% of the Sun’s orbital speed of 107,226km/h.
Since our above analemma sine wave is constituted by four distinct phases (corresponding to our four seasons, i.e.; our four celestial quadrants), we may simply divide the total amount of its annual East-West drift (31.44 min.) by 4, in order to obtain the average amplitude of the Sun’s annual lateral drift:
In one solar year there are 525,948 minutes. Our 7.86 value is 0.00149444% of 525,948 minutes or, lo and behold, near-exactly 0.00149326. This, if you’ll kindly recall, is the TYCHOS “PVP Constant” that represents Earth’s motion around its orbit.

As it is, the Sun, traveling at 107,226 km/h, will cover ca. 14,036 km (the annual distance covered by Earth, as of the TYCHOS model) in 7.86 minutes. As we saw earlier, the Sun covers about half that distance, as viewed from Earth, in 3.93 min. (7.86 / 2) of RA.
Hence, the East-West “lateral component” of the analemma appears to directly correspond to Earth’s orbital speed.
Now, why does the Sun appear to accelerate for only 1.5 months between June and mid-July — yet does so for all of 3+ months between November and February? What causes this substantial annual asymmetry? Moreover, shouldn’t the Sun, on the contrary, appear to decelerate between November and February, since this is the period when Earth’s motion is co-directional with the solar motion, thereby making us catch up somewhat with the Sun?
Well, this is when we need to envision the geometry of the spatial trajectory that an earthly observer will be tracing during the course of one year, in order to conceptualize the geoptical illusion taking place.
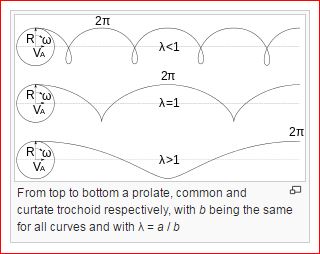
My next graphic plots the path around which any given earthly observer (say, Joe in London) will physically travel each year, as our daily-rotating Earth moves along, covering its annual 14,036 km distance (only slightly more than its own diameter of 12,576 km). This trochoidal path is a natural geometric pattern which any geometers or mathematicians will be quite familiar with.
A Man’s Yearly Path
The annual trochoidal trajectory of an earthly observer (view from above North Pole)

As Earth slowly moves and rotates during the course of the year, “Joe in London” (stargazing from his garden at midnight every night over the course of one year) will be carried around as shown in the above graphic. In fact, all of us earthlings are subjected to this trochoidal path. For instance, any photographer who would patiently snap a picture of the sky at midnight every night (over a full year), will necessarily have to factor in this trochoidal motion of her/his frame of reference, since the path of any given star being monitored over a full year will follow this peculiar trajectory. Thus, to the earthly observer, any given star (our Sun included) will appear to be constantly “accelerating and decelerating” in relation to the observer’s perception of space-time.

Ergo, this trochoidal path represents the ever-shifting-frame-of-reference of earthly observers throughout a year.
We may thus finally envision the principal cause of so many baffling & bewildering observational oddities debated by astronomers throughout the ages; this pesky trochoidal motion will obviously affect all our earthly perceptions of the annual motions of our surrounding planets and stars, the Sun included. We can see how this annual prolate trochoid can not only provide a definitive explanation for the “analemma dilemma” (see below graphic) but also, a great many of the most hotly debated puzzles, riddles and mysteries of cosmology. To name just a few:
• James Bradley’s puzzlement at the entirely unexpected observed motions of the (circumpolar) stars that he monitored for several years, and which ultimately led him to formulate his dauntingly abstruse (and long-disproved) “stellar aberration” theory.
• Ole Roemer’s perplexity as to the apparent, fluctuating orbital periods of Jupiter’s moon “Io” — which ultimately led him to formulate his (grossly approximated) speed-of-light-estimation that notoriously met with strong scepticism among his contemporaries.
• Johannes Kepler’s bewilderment at the apparent accelerations & decelerations of the orbital speed of Mars, which ultimately led him to formulate his “Laws of planetary motion” all based upon the idea that all of our solar system’s planets revolve around very slightly elliptical orbits rather than uniformly circular orbits.
“Calculations of the orbit of Mars, whose published values are somewhat suspect, indicated an elliptical orbit. From this, Johannes Kepler inferred that other bodies in the including those farther away from the Sun, also have elliptical orbits.”
— from Wikipedia entry for “Kepler’s laws of planetary motion“
Indeed, Kepler only inferred that our other planets’ orbits are also elliptical on the strength of his (“somewhat suspect”) calculations of Mars’s orbit. We may now reasonably surmise that Kepler’s proposed elliptical orbits were illusory — and the result of some ad hoc mathematical alchemy he indulged in, so as to make Tycho Brahe’s observations fit into his favored Copernican model.
I now submit my best, definitive explanation for the analemma phenomenon. Although my next graphic may contain a handful of text and conceptual visuals, I hope that it may clearly convey the peculiar “space-time” mechanism responsible for the apparent accelerations and decelerations of the Sun throughout the year.

In conclusion, the lateral component of the Analemma is caused by a combination of two concurring factors:
• the seasonally-reversing relative spatial motions of Earth and the Sun
• the annual trochoidal path around which any earthly observer will “swirl”
The latter will cause the Sun to appear to accelerate during our Northern hemisphere’s winter months.
One may wonder if stars observed over long periods of time reveal that they are exhibiting trochoidal paths. As a matter of fact, we do have empirical evidence that they do. Here follows an illustration plotting the observed multi-annual path (between 2012 and 2016) of our nearmost star, Proxima Centauri. It clearly exhibits a trochoidal path (the green looped line) as would be logically expected under the TYCHOS model paradigm.
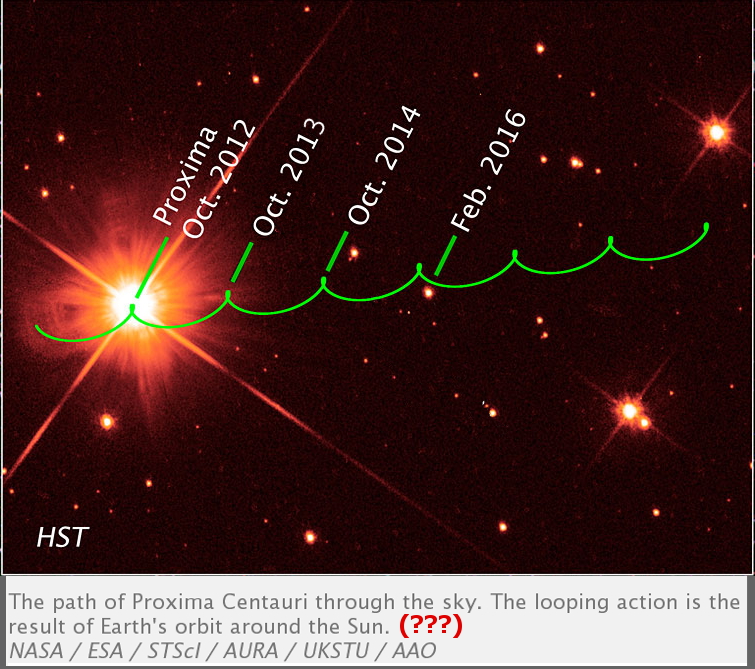
The caption tells us that “the looping action is the result of Earth’s orbit around the Sun”. How Earth’s annual revolution around the Sun, as of Copernican theory, could possibly generate such an elongated trochoidal pattern has no conceivable explanation.
On the other hand, the TYCHOS model can plainly illustrate why Proxima Centauri is observed to trace a trochoidal path:

In the above graphic, Earth’s size versus that of its orbit is exaggerated for graphic clarity. An earthbound observer of Proxima Centauri would note, over several years, that the star would appear to advance on a “bobbing” motion line. Why would Proxima Centauri exhibit such a multiannual trochoidal path under the Copernican model’s tenets? In reality, any star being monitored for several successive years will naturally exhibit this trochoidal path, since any astronomer measuring from a fixed location on Earth is subjected to it.
Here follows another diagram plotting the observed motion of star Vega over a three-year period. As you can see, Vega traces a three-year-long trajectory which is perfectly consistent with the geometric principles of the TYCHOS model.
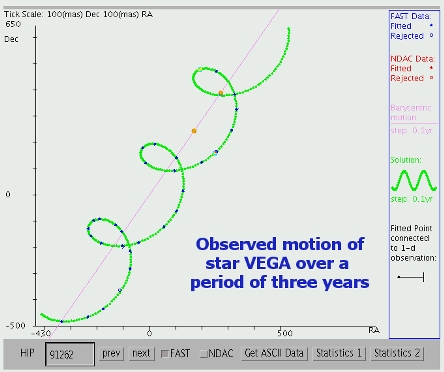
Above – from Heliocentric parallax by Michael Richmond (2014) for Rochester Inst. of Technology
What all of this implies should be intuitively obvious:
1. All astronomical observations must necessarily take into account this annual trochoidal motion of our earthly reference frame.
2. This trochoidal motion is the root cause (along with the seasonally-reversing relative motions of Earth and the Sun) for our need of the Equation of Time – the function of which is an attempt at equalizing the irregular lateral drift of our “time-keeper”, the Sun.
3. Our earthly trochoidal motion goes to resolve a number of age-old, astronomical riddles in relation to matters pertaining to stellar motions, parallax, the Equation of Time and all the way to James Bradley’s arcane “stellar aberration” theory.
In fact, as I made the above graphic titled “A Man’s Yearly Path”, I had in mind Astronomer Royal James Bradley, the man widely credited with proving, once and for all, that Earth revolves around the Sun. The entirely unexpected stellar motions that Bradley had observed made no sense whatsoever under the Copernican heliocentric theory, and caused a humongous stir among the scientific community. Little did Bradley know of the annual, trochoidal path affecting his own body, telescope and frame of reference!
As one reads the detailed accounts of Bradley’s famed, multi-annual observations of stellar motions, it becomes clear that what Bradley describes is just what would be expected within the rotational framework of the TYCHOS model. He eventually concocted a bizarre ad hoc antidote to his problem, namely the infamous “aberration of light” theory, which I will tackle in Chapter 34.